Belgian LifeWatch eLab Getway
To access the Belgian LifeWatch E-Lab, click here: http://www.lifewatch.be/data-services
To access the Belgian LifeWatch E-Lab, click here: http://www.lifewatch.be/data-services
You can reach the entire Belgian LifeWatch E-Lab team through info@lifewatch.be.
Several data services are available in the Belgian LifeWatch E-Lab:

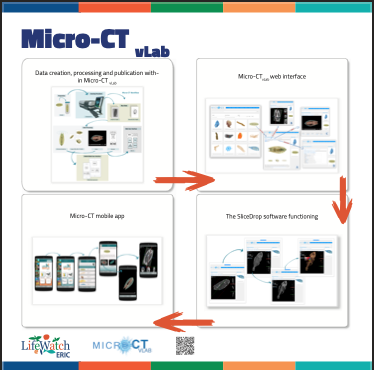
This vLab is composed of two online coupled models, which are parameterised and initialised for the specific conditions at a few specifically identified areas for which the required datasets exist. In an attempt to make the tool user friendly a graphic user interface (GUI) developed in the course of previous projects will be used. The GUI allows the user to view model results dynamically through any internet browser. Model results will be stored at the HCMR servers and the user will be able to select the area, scenario, and parameter required, which will then be returned as results in the form of plots. All model parameters and options will be available to the user online. The ultimate operation, therefore, of this vLab will be to allow the user to submit a request for the model to run under a different scenario than those already available.
Click here to access the vLab.
Point of contact: Emmanouela Panteri (emmipan[at]hcmr.gr) – LifeWatchGreece, HCMR

Please follow this link to find the RShiny LifeWatch Data Explorer
Several thematic portals have been set up as part of the Data Explorer:
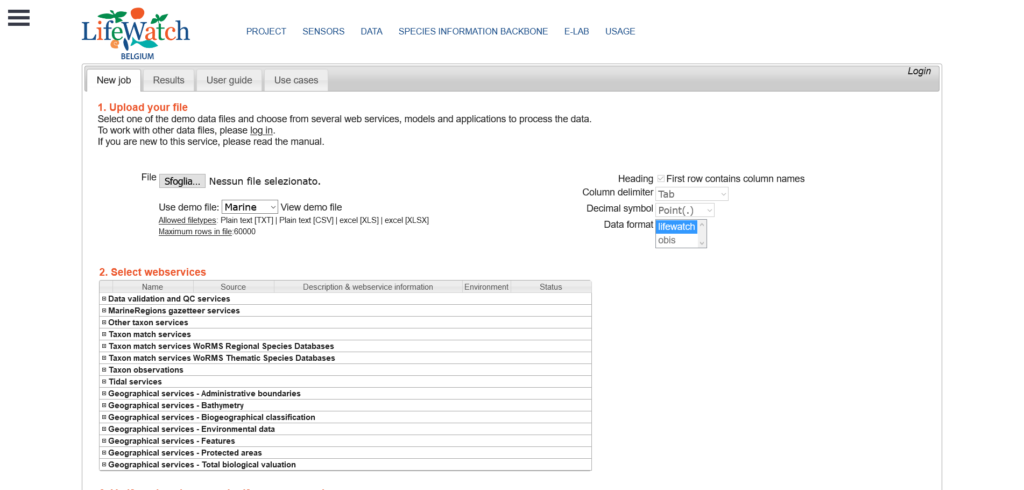
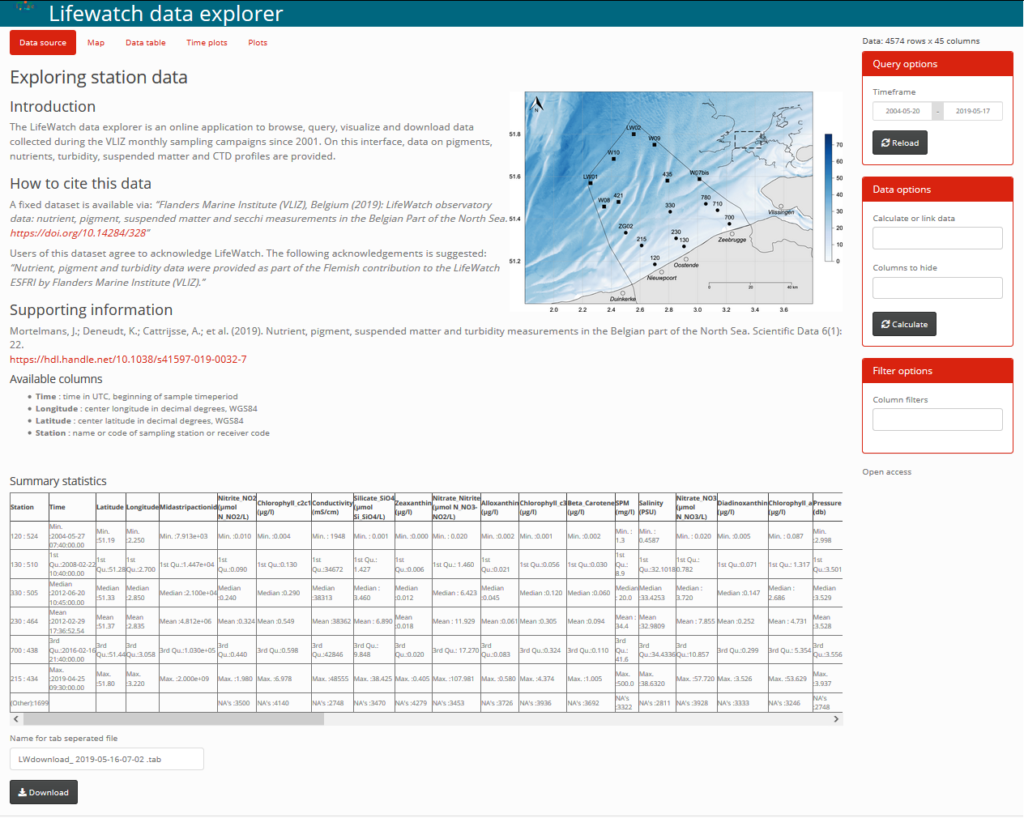
Within the RShiny LifeWatch Data Explorer, five general sections are available to explore, plot, visualize and download data.
Some of the more recent data is temporarily under moratorium and therefore protected by password access.
An online manual gives a detailed overview of all functionalities.
The LifeWatch Data Explorer is built using RShiny server, Leaflet, ggplot2, PLotly, Dygraph and DataTables. The system is able to query MSSQL, PostgreSQL, Geoserver (WFS) and MongoDB servers.